l |
l |
l |
 |
Examining the Effect of Ancillary and Derived Geographical Data on Improvement of Per-Pixel Classification Accuracy of Different Landscapes |
 |
1Energy & Wetlands Research Group [CES TE15], Centre for Ecological Sciences, Indian Institute of Science,
Third Floor, E Wing, New Bioscience Building [Near D Gate], Bangalore, Karnataka 560012, India
2Department of Management Studies, Indian Institute of Science, Bangalore, Karnataka 560 012, India
3Centre for Sustainable Technologies (Astra), Indian Institute of Science, Bangalore, Karnataka 560 012, India
4Centre for Infrastructure, Sustainable Transportation and Urban Planning (CiSTUP), Indian Institute of Science, Bangalore, Karnataka 560 012, India
5NASA Ames Research Center, Moffett Field, Mountain View, CA 94035, USA
l |
l |
l |
l |
l |
l |
Results and Discussion
4.1. Urban classification using IKONOS MS bands
It was observed that EVI highlight non-woody vegetation better than NDVI where the elevation ranged from 883 to 940 m. Figure 2 is the output from the 8 classifications as explained in Table 5 using RF. Figure 2 (Classification No. 1) is the classified output of IKONOS 4 bands using RF. Classification No. 2 is the output after adding NDVI as an additional layer to the input in the classifier, where two classes are missing (asbestos roof and open area). Overall, blue plastic roof is over estimated (which is not a consequence of training error) as evident from Fig. 2 and area statistics in Table 5. The role of NDVI in discriminating non-vegetation area is negligible and therefore asbestos and open areas have merged with concrete roof and blue plastic with a drastic decrease in overall accuracy (47%) as shown in Table 6. When EVI was added as an additional derived layer, classification was better compared to the inclusion of NDVI. However, the class composition is either under estimated (concrete roof, vegetation and open area) or over estimated (blue plastic roof) lowering the overall accuracy to 55%. Blue plastic roof was also over estimated when both EVI and DEM were added as input layers along with the original bands. As evident from Fig. 2, concrete roof and open area have been misclassified and merged to blue plastic roof, which is dominant in the scene. Asbestos roof and vegetation are the two classes which showed higher producer’s and user’s accuracies. However, the overall accuracy still remained low (49.28%). Similar situation prevails when DEM, slope and aspect were included with the input IKONOS MS bands to the classifier. Concrete roof, open area and vegetation areunder estimated and blue plastic roof is over estimated, bringing the overall accuracy to as low as 55%. The output worsens when DEM, slope, aspect with EVI were considered additionally to the input. All the classes are either over estimated or under estimated with overall accuracy of 51% (Table 6).
In classification No. 8, when only DEM and texture measures were added (Table 1) as input to the classifier apart from IKONOS 4 MS bands, the overall accuracy went high to 88.72% with high producer’s and user’s accuracies for individual classes which were classified properly (Table 5). The experiments conclude that in a highly urbanised area with less vegetation cover and highly contrasting features, texture plays a major role in discriminating individual classes which are rather difficult to distinguish using only original high spatial resolution IKONOS MS bands as evident from high classification accuracies in Table 6 and area statistics in Table 5 (Classification No. 4 and 8 highlighted in bold), compared to the classification of only IKONOS 4 MS bands (Classification No. 1 highlighted in bold). However, in Classification No. 4, concrete roof in top and bottom left areas of the image have been misclassified as open area as also evident from Table 5. DEM plays a role when the terrain is undulating but derived layers such as slope and aspect did not aid in discriminating classes when the elevation had low variance. Due to limited vegetation presence (a few parks) in the study area, EVI was not useful in classification. Overall 3.5% improvement in accuracy was observed after including elevation and texture along with the original bands as input to the classifier.
| Area | Class | ||||||
| Concrete roof | Asbestos roof | Blue plastic roof | Vegetation | Open area | Total | ||
| Classification No. 1 | ha | 351.74 | 9.53 | 1.88 | 260 | 158.80 | 781.76 ha |
| % | 44.99 | 1.22 | 0.24 | 33.26 | 20.66 | (100%) | |
| Classification No. 2 | ha | 324.51 | – | 285.02 | 172.23 | - | |
| % | 41.51 | - | 36.46 | 22.03 | - | ||
| Classification No. 3 | ha | 299.89 | 7.26 | 259.32 | 188.17 | 27.11 | |
| % | 38.36 | 0.93 | 33.17 | 24.07 | 3.47 | ||
| Classification No. 4 | ha | 344.74 | 8.82 | 1.42 | 259.98 | 166.8 | |
| % | 44.1 | 1.13 | 0.18 | 33.25 | 21.34 | ||
| Classification No. 5 | ha | 84.53 | 11.20 | 385.11 | 244.86 | 56.06 | |
| % | 10.81 | 1.43 | 49.26 | 31.32 | 7.17 | ||
| Classification No. 6 | ha | 142.56 | 17.44 | 331.30 | 218.02 | 72.44 | |
| % | 18.24 | 2.23 | 42.38 | 27.89 | 9.27 | ||
| Classification No.7 | ha | 126.17 | 16.13 | 433.22 | 146.88 | 59.36 | |
| % | 16.14 | 2.06 | 55.42 | 18.79 | 7.59 | ||
| Classification No.8 | ha | 354.88 | 7.93 | 0.95 | 259.33 | 158.66 | |
| % | 45.40 | 1.22 | 0.12 | 33.17 | 20.30 | ||
Table 5 Area statistics obtained from the IKONOS classified images

| Area | Class | |||||||
| Concrete roof | Asbestos roof | Blue plastic roof | Vegetation | Open area | OA (%) | Kappa | ||
| Classification No. 1 | PA (%) | 88.20 | 83.92 | 84.00 | 83.19 | 86.92 | 85.25 | 0.8250 |
| UA (%) | 88.99 | 81.00 | 87.00 | 82.77 | 88.00 | |||
| Classification No. 2 | PA (%) | 76.22 | – | 17.01 | 48.55 | - | 47.63 | 0.4136 |
| UA (%) | 69.45 | - | 21.97 | 51.33 | - | |||
| Classification No. 3 | PA (%) | 83.77 | 91.34 | 10.55 | 48.00 | 18.00 | 55.05 | 0.5117 |
| 70.53 | 97.63 | 42.31 | 41.38 | 17.09 | ||||
| Classification No. 4 | PA (%) | 84.15 | 89.48 | 88.53 | 85.07 | 82.18 | 85.88 | 0.8437 |
| UA (%) | 83.57 | 84.39 | 89.11 | 85.95 | 84.79 | |||
| Classification No. 5 | PA (%) | 42.89 | 73.94 | 10.05 | 78.53 | 55.91 | 49.28 | 0.4577 |
| UA (%) | 22.05 | 75.9 | 19.23 | 83.91 | 30.37 | |||
| Classification No. 6 | PA (%) | 57.55 | 67.58 | 18.06 | 78.66 | 57.81 | 55.37 | 0.5322 |
| UA (%) | 55.04 | 72.55 | 21.23 | 73.84 | 51.41 | |||
| Classification No.7 | PA (%) | 58.38 | 51.43 | 12.05 | 76.25 | 65.99 | 51.06 | 0.4719 |
| UA (%) | 51.31 0 | 58.45 | 17.69 | 64.37 | 54.70 | |||
| Classification No.8 | PA (%) | 92.57 | 89.25 | 89.00 | 86.13 | 88.37 | 88.72 | 0.8615 |
| UA (%) | 90.00 | 82.00 | 88.00 | 90.15 | 91.75 | |||
Table 6 Accuracy assessment of the IKONOS classified images
4.2. Urban Classification Using Landsat ETM +Bands
Figure 3 shows output from the seven classified images and LU statistics are listed in Table 7. The producer’s, user’s, overall accuracies and kappa are given in Table 8. Figure 3 indicates that outputs obtained from the original spectral bands along with temperature, NDVI, EVI, elevation, slope and aspect (Classification No. 1, 2, 3 and 4) have misclassified many pixels belonging to builtup, water and open area. Many of the tarred or concrete road pixels that actually belong to builtup have been classified as water. Thus water class has been over estimated. From accuracy assessment in Table 8, we see that Classification No. 5, 6 and 7 have higher accuracies compared to other classifications. Inclusion of temperature increased accuracy whereas addition of vegetation index layers along with elevation, slope and aspect decreased the overall accuracy. When both temperature and vegetation index with elevation, slope and aspect were used, the accuracy still decreased. However, inclusion of texture and PAN significantly increased the overall accuracy of all the classes including urban and water bodies as evident from Table 7 and Table 8 (highlighted in bold). There was a 7.6% increase in accuracy by adding temperature, NDVI, EVI, elevation, slope, aspect, PAN along with texture measures, which proved to be useful for medium spatial resolution data such as ETM + while discriminating different classes in an urban environment.
| Area | Class | |||||
| Urban | Vegetation | Water | Open area | Total | ||
| Classification No. 1 | ha | 4543.14 | 1911.89 | 600.32 | 1999.25 | 9054.62 ha |
| % | 50.17 | 21.12 | 6.63 | 22.08 | (100%) | |
| Classification No. 2 | ha | 4014.78 | 1825.96 | 560.71 | 2653.15 | |
| % | 44.34 | 20.17 | 6.19 | 29.30 | ||
| Classification No. 3 | ha | 4245.71 | 1884.53 | 471.43 | 2446.04 | |
| % | 46.93 | 20.83 | 5.21 | 27.03 | ||
| Classification No. 4 | ha | 3450.37 | 1854.25 | 554.54 | 3188.55 | |
| % | 38.14 | 20.49 | 6.13 | 35.24 | ||
| Classification No.5 | ha | 5262.71 | 1905.61 | 93.96 | 1754.99 | |
| % | 58.36 | 21.13 | 1.04 | 19.46 | ||
| Classification No.6 | ha | 5226.04 | 1887.87 | 86.47 | 1816.89 | |
| % | 57.96 | 20.94 | 0.96 | 20.15 | ||
| Classification No.7 | ha | 5164.41 | 1974.06 | 65.70 | 1813.11 | |
| % | 57.27 | 21.89 | 0.73 | 20.11 | ||
Table 7 Area statistics obtained from the Landsat ETM+ classified images for Bangalore City

| Area | Class | ||||||
| Urban | Vegetation | Water | Open area | OA (%) | Kappa | ||
| Classification No. 1 | PA (%) | 73.94 | 87.45 | 66.91 | 74.62 | 75.50 | 0.7309 |
| UA (%) | 76.92 | 84.36 | 61.00 | 78.82 | |||
| Classification No. 2 | PA (%) | 76.22 | 87.99 | 68.62 | 79.52 | 77.94 | 0.7548 |
| UA (%) | 78.73 | 83.05 | 65.28 | 81.03 | |||
| Classification No. 3 | PA (%) | 71.88 | 78.87 | 69.96 | 71.09 | 73.12 | 0.7101 |
| UA (%) | 74.70 | 77.95 | 65.23 | 75.29 | |||
| Classification No. 4 | PA (%) | 68.33 | 81.87 | 57.34 | 77.11 | 71.43 | 0.6811 |
| UA (%) | 75.19 | 78.33 | 59.61 | 72.55 | |||
| Classification No.5 | PA (%) | 83.57 | 82.41 | 78.91 | 81.88 | 81.84 | 0.7978 |
| UA (%) | 83.64 | 83.37 | 80.85 | 81.76 | |||
| Classification No.6 | PA (%) | 83.99 | 82.59 | 79.15 | 82.13 | 82.29 | 0.8077 | UA (%) | 83.94 | 83.77 | 81.17 | 82.44 |
| Classification No.7 | PA (%) | 84.91 | 88.21 | 81.11 | 83.62 | 83.15 | 0.8125 |
| UA (%) | 81.17 | 81.57 | 84.23 | 80.51 | |||
Table 8 Accuracy assessment of the Landsat ETM+ classified images for Bangalore City
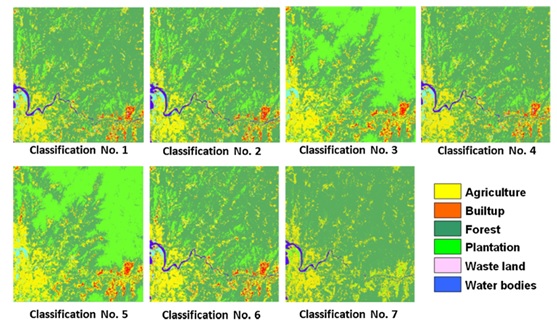
4.3. Forested Landscape with Undulating Terrain Classification: Uttara Kannada, Central Western Ghats
Figure 4 shows output from the seven classified images and the LU statistics are listed in Table 9. The producer’s,user’s and overall accuracies with kappa are given in Table 10. Inclusion of NDVI in spectral bands classification produced very low accuracy, so was removed from further analysis. Figure 4 shows that addition of elevation, slope and aspect did not improve classification accuracy (Classification No. 3 and 5), and hence were removed from subsequent classifications. Addition of these layers misclassified forest as plantation ([40% of the area was misclassified as plantation) and wasteland were under estimated. Water bodies could not be detected.
Outputs obtained from original spectral bands along with temperature, EVI and PAN (Classification No. 2, 4 and 6) have improved classification results. Texture could not resolve differences between plantation and forest, and plantation was under estimated in classification. From Table 10, it is evident that temperature plays a major role in classification in a forested area which had highest classification accuracy (Classification No. 2 with 88.26% overall accuracy highlighted in bold in Table 10). EVI increased the classification accuracy by 4.3% (Classification No. 4) and temperature, EVI and PAN together increased the overall accuracy by 1.6% (in Classification No. 6) compared to the classification of only original spectral bands. All other layer combinations decreased the accuracy. Overall, the highest classification accuracy improved by 6.7% with temperature as an additional layer.
| Area | Class | ||||||
| Agriculture | Builtup | Forest | Plantation | Wasteland | Water | ||
| Classification 1 | ha | 8721.71 | 730.03 | 37671.87 | 4197.55 | 885.99 | 651.34 |
| % | 16.5 | 1.38 | 71.26 | 7.94 | 1.68 | 1.23 | |
| Classification 2 | ha | 8179.03 | 853.60 | 36978.03 | 5194.64 | 929.38 | 723.79 |
| % | 15.47 | 1.61 | 69.96 | 9.83 | 1.76 | 1.37 | |
| Classification 3 | ha | 9314.73 | 889.17 | 20812.48 | 21359.72 | 482.38 | – |
| % | 17.62 | 1.68 | 39.37 | 40.41 | 0.91 | – | |
| Classification 4 | ha | 8973.28 | 709.15 | 37594.65 | 4058.98 | 898.02 | 624.40 |
| % | 16.98 | 1.34 | 71.12 | 7.68 | 1.70 | 1.18 | |
| Classification 5 | ha | 9737.47 | 851.73 | 19589.41 | 22217.03 | 462.84 | – |
| % | 18.42 | 1.61 | 37.06 | 42.03 | 0.88 | - | |
| Classification 6 | ha | 9455.82 | 892.81 | 36491.99 | 4745.47 | 604.38 | 666.02 |
| % | 17.89 | 1.69 | 69.04 | 8.98 | 1.14 | 1.26 | |
| Classification 7 | ha | 8558.35 | 8.50 | 42688.61 | 276.25 | 822.53 | 504.24 |
| % | 16.19 | 0.02 | 80.76 | 0.52 | 1.56 | 0.95 | |
Table 9 Area statistics obtained from the Landsat ETM+ classified images (part of Central Western Ghats)
| Area | Class | ||||||||
| Agriculture | Builtup | Forest | Plantation | Wasteland | Water | OA | Kappa | ||
| Classification 1 | PA | 74.36 | 81.15 | 79.55 | 81.00 | 78.72 | 81.88 | 81.56 | 0.7856 |
| UA | 86.67 | 83.85 | 77.80 | 84.62 | 80.00 | 82.59 | |||
| Classification 2 | PA | 92.86 | 88.15 | 87.20 | 85.66 | 88.72 | 89.56 | 88.26 | 0.8643 |
| UA | 86.67 | 88.15 | 89.66 | 86.92 | 87.00 | 89.44 | |||
| Classification 3 | PA | 61.76 | 68.18 | 61.90 | 53.85 | 55.22 | – | 61.59 | 0.4931 |
| UA | 66.67 | 59.22 | 65.14 | 62.31 | 57.48 | – | |||
| Classification 4 | PA | 78.74 | 88.15 | 83.78 | 80.09 | 88.72 | 85.55 | 85.87 | 0.8326 |
| UA | 96.67 | 88.15 | 81.23 | 82.31 | 81.11 | 87.23 | |||
| Classification 5 | PA | 61.84 | 68.19 | 61.81 | 59.49 | 65.19 | – | 61.69 | 0.4874 |
| UA | 63.34 | 60.33 | 55.59 | 60.31 | 60.65 | - | |||
| Classification 6 | PA | 83.34 | 81.91 | 77.38 | 79.91 | 85.28 | 88.01 | 83.16 | 0.8014 |
| UA | 85.55 | 82.48 | 81.68 | 82.30 | 83.77 | 86.34 | |||
| Classification 7 | PA | 84.55 | 71.88 | 74.88 | – | 72.00 | 81.00 | 77.64 | 0.7552 |
| UA | 80.73 | 62.96 | 78.02 | – | 83.51 | 88.58 | |||
Table 10 Accuracy assessment of the Landsat ETM+ classified images from a part of Central Western Ghats
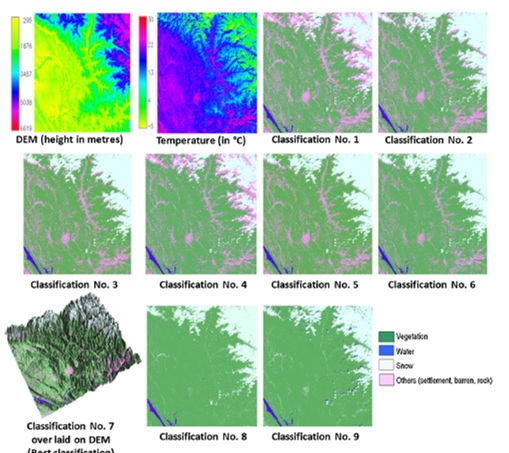
Mountainous Terrain: Mandhala Watershed, Western Himalaya
Figure 5 shows output from the nine classified images, LC tatistics are listed in Table 11 and accuracy assessment is given in Table 12. Figure 5 shows that classification of only 6 spectral bands and addition of EVI (Classification No. 1 and 4) have over estimated the ‘‘others’’ category. In Classification No. 8 (ETM+ bands 1, 2, 3, 4, 5, 7 with temperature, EVI and texture) and Classification No. 9 (ETM+ bands 1, 2, 3, 4, 5, 7 and texture), others category was not identified. In both these cases, vegetation was over estimated because of misclassification of others category. The optimum LC classification result with different layers is highlighted in bold in Table 11 (Classification No. 7). From accuracy assessment (Table 12), it is evident that addition of each layer in subsequent classifications improvised the classification accuracy (Classification No. 2–7), compared to only spectral bands (Classification No. 1). Output obtained from original spectral bands along with temperature, EVI, elevation, slope, aspect and PAN showed highest classification accuracy. However, addition of texture did not show any improvement in classification (Classification No. 8 and 9). Addition of temperature layer increased the classification accuracy by 3.76% (Classification No. 2), elevation by 4.18% (Classification No. 3), EVI by 1% (Classification No. 4), elevation, slope and aspect by 5.32% (Classification No. 5) and temperature, EVI, elevation, slope, aspect and PAN together increased the overall accuracy by 10.84% (in Classification No. 7) compared to the classification of only original spectral bands. From Table 12, it is evident that in a rugged terrain with temperate climate, temperature, EVI, elevation, slope, aspect and PAN play major role in improving the classification with highest accuracy (89.97% in Classification No. 7 highlighted in bold in Table 12). However, texturcombinations decreased the accuracy.
| Area | Class | ||||
| Vegetation | Water | Snow | Others (settlement, barren, rock) | ||
| Classification 1 | ha | 916357 | 12,725 | 168,825 | 352,291 |
| % | 63.19 | 0.88 | 11.64 | 24.29 | |
| Classification 2 | ha | 940,477 | 12,538 | 248,346 | 248,838 |
| % | 64.85 | 0.86 | 17.12 | 17.16 | |
| Classification 3 | ha | 939,836 | 12,410 | 269,573 | 228,379 |
| % | 64.81 | 0.86 | 18.52 | 15.75 | |
| Classification 4 | ha | 984,622 | 12,677 | 176,550 | 276,350 |
| % | 67.90 | 0.87 | 12.17 | 19.06 | |
| Classification 5 | ha | 962,457 | 12,484 | 276,213 | 199,044 |
| % | 66.37 | 0.86 | 19.05 | 13.73 | |
| Classification 6 | ha | 1,008,109 | 12,441 | 280,383 | 149,265 |
| % | 69.52 | 0.86 | 19.33 | 10.29 | |
| Classification 7 | ha | 1,009,705 | 12,423 | 279,577 | 148,493 |
| % | 69.63 | 0.86 | 19.28 | 10.24 | |
| Classification 8 | ha | 1,156,003 | 11,202 | 282,994 | - |
| % | 79.71 | 0.77 | 19.51 | – | |
| Classification 9 | ha | 1,172,211 | 20,207 | 257,781 | – |
| % | 80.83 | 1.39 | 17.78 | – | Total | ha | 1,450,198 |
| % | 100 | ||||
Table 11 Area statistics obtained from the Landsat ETM+ classified images of Western Himalaya
| Area | Class | ||||||
| Vegetation | Water | Snow | Others (settlement, barren, rock) | OA | Kappa | ||
| Classification 1 | PA | 71.78 | 88.11 | 86.00 | 71.00 | 79.13 | 0.77890 |
| UA | 73.13 | 85.98 | 84.00 | 73.00 | |||
| Classification 2 | PA | 79.78 | 89.09 | 87.22 | 75.29 | 82.98 | 0.7999 |
| UA | 81.02 | 85.98 | 85.09 | 78.31 | |||
| Classification 3 | PA | 79.46 | 88.78 | 83.29 | 79.85 | 83.31 | 0.8122 |
| UA | 82.45 | 89.36 | 85.90 | 77.06 | |||
| Classification 4 | PA | 79.78 | 81.09 | 80.98 | 79.03 | 80.18 | 0.7865 |
| UA | 78.21 | 82.98 | 82.45 | 77.10 | |||
| Classification 5 | PA | 83.33 | 87.93 | 84.49 | 85.29 | 84.45 | 0.8222 |
| UA | 85.00 | 88.17 | 80.22 | 83.30 | |||
| Classification 6 | PA | 85.06 | 88.20 | 85.21 | 86.91 | 87.23 | 0.8511 |
| UA | 87.25 | 89.90 | 87.35 | 88.22 | |||
| Classification 7 | PA | 89.11 | 90.01 | 88.58 | 89.27 | 89.97 | 0.8755 |
| UA | 88.15 | 92.90 | 90.70 | 91.01 | |||
| Classification 8 | PA | 76.89 | 80.00 | 79.28 | – | 78. 91 | 0.7581 |
| UA | 78.50 | 77.28 | 81.51 | – | |||
| Classification 9 | PA | 70.18 | 80.57 | 77.04 | – | 77.19 | 0.7441 |
| UA | 79.50 | 76.70 | 79.17 | – | |||
Table 12 Accuracy assessment of the Landsat ETM+ classified images (Western Himalaya)
In this work, derived and ancillary layers were assessed for their performance in improving classification accuracy in three different terrains such as urbanised landscape, forested landscape with undulation and rugged terrain with temperate climate. The results provided new insights to the likelihood of improved performance of LC classification by use of supplemental layers related to the region along with the RS data. IKONOS data were used only for urban area classification along with many other layers of elevation and texture. The enhanced characteristics of IKONOS MS and PAN compared to Landsat ETM? or IRS LISS-III highlighted some typical urban features such as buildings and narrow roads in residential areas compared to the latter (Fig. 2, 3). IKONOS image not only reduced the mixed pixel problem, but also provided a rich texture and contextual information than Landsat ETM+ MS bands with 15 or 30 m spatial resolution. Earlier works (Gong et al. 1992; Shaban and Dikshit 2002) have used SPOT HRV data for urban classification due to its high spatial resolution comparing with Landsat ETM data. Knowledge based expert system have also been used with MS imagery and LiDAR data to delineate impervious surface in urban areas (Germaine and Hung 2011). The study confirmed that high spatial resolution is considered to be more important than high spectral resolution in urban classification (Jensen and Cowen 1999). In IKONOS data classification, when only DEM and texture measures were added as input to the classifier apart from IKONOS 4 spectral bands, the overall accuracy went high to 88.72% (3.5% improvement) with high producer’s and user’s accuracies for individual classes, which is comparable to the overall accuracy obtained by classifying QuickBird imagery for LC classification in a complex urban environment based on texture (overall accuracy—87.33%) and segmentation (overall accuracy—88.33%) by Lu et al. (2010). Although it is difficult to identify suitable texture which is dependent on image band and window size for the specific study (Chen et al. 2004), appropriate texture measures reduce spectral variation within same LC and also improves spectral separability among different LC classes (Augera et al. 2008; Lu et al. 2008a, b). It is to be noted that derived layers from elevation such as slope and aspect did not aid in discriminating classes and EVI did not prove useful in classification due to poor vegetation cover in the urban area. Addition of temperature, NDVI, EVI, elevation, slope, aspect, PAN and texture layers with Landsat ETM? spectral bands 1, 2, 3, 4, 5 and 7, significantly improved the classification accuracy by 7.6%, which proved to be useful with medium spatial resolution data in an urban area.In a forested terrain, temperature played major role in classification, producing highest classification accuracy (88.26%), which is an improvement of 6.7% compared to the classification of only spectral bands. Because of various complex surface features, hilly regions are difficult to classify using RS data. In a rugged terrain with temperate climate and high altitudinal variations, inclusion of temperature, EVI, elevation, slope, aspect and PAN layers played a major role in increasing the classification accuracy to 89.97% (improvement by 10.84%), compared to the classification of only original spectral bands. This accuracy is higher than use of fractal dimension data and original ETM+ data in a Chinese subtropical hilly region (accuracy of 80.69%) by Zhu et al. (2011). Individually, the maximum increase in overall accuracy was noticed by the addition of slope and aspect to the original spectral bands (improvement in classification accuracy by 5.32%). However, in addition to the use of ancillary layers such as textural images, selection of different seasonal images are also needed to improve classification performance (Luet al. 2010; Masocha and Skidmore 2011). Selection of a particular set of derived geographical input data along with the original spectral bands for LC classification is generally subjective or random without much insightful consideration, and in most cases ancillary layers are used without the knowledge of their meaningful impact on the final classification result. The present study showed that different combination of the input data can lead to different separation of classes in the feature space. Different classification algorithms can also lead to different compartmentation of the feature space with respect to the classes and both choices can affect the final classification result. In such cases, discussing the aspect of individual derived geographical layers is meaningful. Further, future analysis will focus on the effect and role of ancillary and derived geographical layers in improving the classification accuracy along with new methods of expert classification being developed.

| * Corresponding Author : | |||
| Dr. T.V. Ramachandra Energy & Wetlands Research Group, Centre for Ecological Sciences, Indian Institute of Science, Bangalore – 560 012, INDIA. Tel : 91-80-23600985 / 22932506 / 22933099, Fax : 91-80-23601428 / 23600085 / 23600683 [CES-TVR] E-mail : tvr@iisc.ac.in, emram.ces@courses.iisc.ac.in, energy.ces@iisc.ac.in, Web : http://wgbis.ces.iisc.ac.in/energy |
|||